Front Panel Monitor 2
Almost exactly ten years ago, I embedded a tiny monitor into the front of my fileserver, and wrote an app to display some useful statistics on it. Although it all currently works, the 3rd-party libraries I used for the app are no longer supported, which makes updating it difficult, so I decided to re-write it in a way that will hopefully be easier to maintain. I also wanted to replace the monitor. The original monitor also still works fine, but the analogue VGA input means that the picture is slightly blurry compared to a monitor with a digital input. This can be mitigated by adjusting the monitor's settings, but unfortunately it doesn't remember its settings after being powered-off, so the picture ends up always misaligned.
Software
One improvement I wanted to make was to allow the statistics to be viewed remotely, not only on the embedded monitor. To achieve this I split the new app into two parts: A server that reads the stats and provides access to them over an HTTP API, and a client that accesses the API and displays the stats. The client is just a web page, so it can be viewed anywhere, even from outside my LAN.
Server
I wrote the server in Python, for no particular reason other than that I haven't written much Python and wanted to learn a bit more. There's not much to it; it calls PowerShell to read various statistics via WMI, uses the very minimal HTTP capabilities provided by Python's built-in BaseHTTPRequestHandler to serve those values, as well as some static HTML/JS/CSS files for the client.
There's only small amount of code, so I've reproduced the whole thing here:
Because it uses WMI, the server only works on Windows. It would be possible to add support for the equivalents of WMI for other operating systems, but I have no reason to do so at the moment.
Client
This is just a web page, with JavaScript making requests to the Python API and displaying the values in charts. Charting is handled by Chartist, which unfortunately appears to be abandoned. I can maintain it myself if required though. There's a lot more JavaScript than Python, but it's still small enough to embed here:
I made use of newer features like async/await, so it requires a newer browser to run, i.e. it won't work in Internet Explorer.
Hardware
I purchased an Innolux AT056TN53, which is very similar to the old monitor, except that it came with a controller with an HDMI input. It also has a brighter backlight than the old panel. Much too bright in fact, and the controller doesn't properly support dimming it even though the panel itself should, so I had to modify it a bit to reduce the brightness.
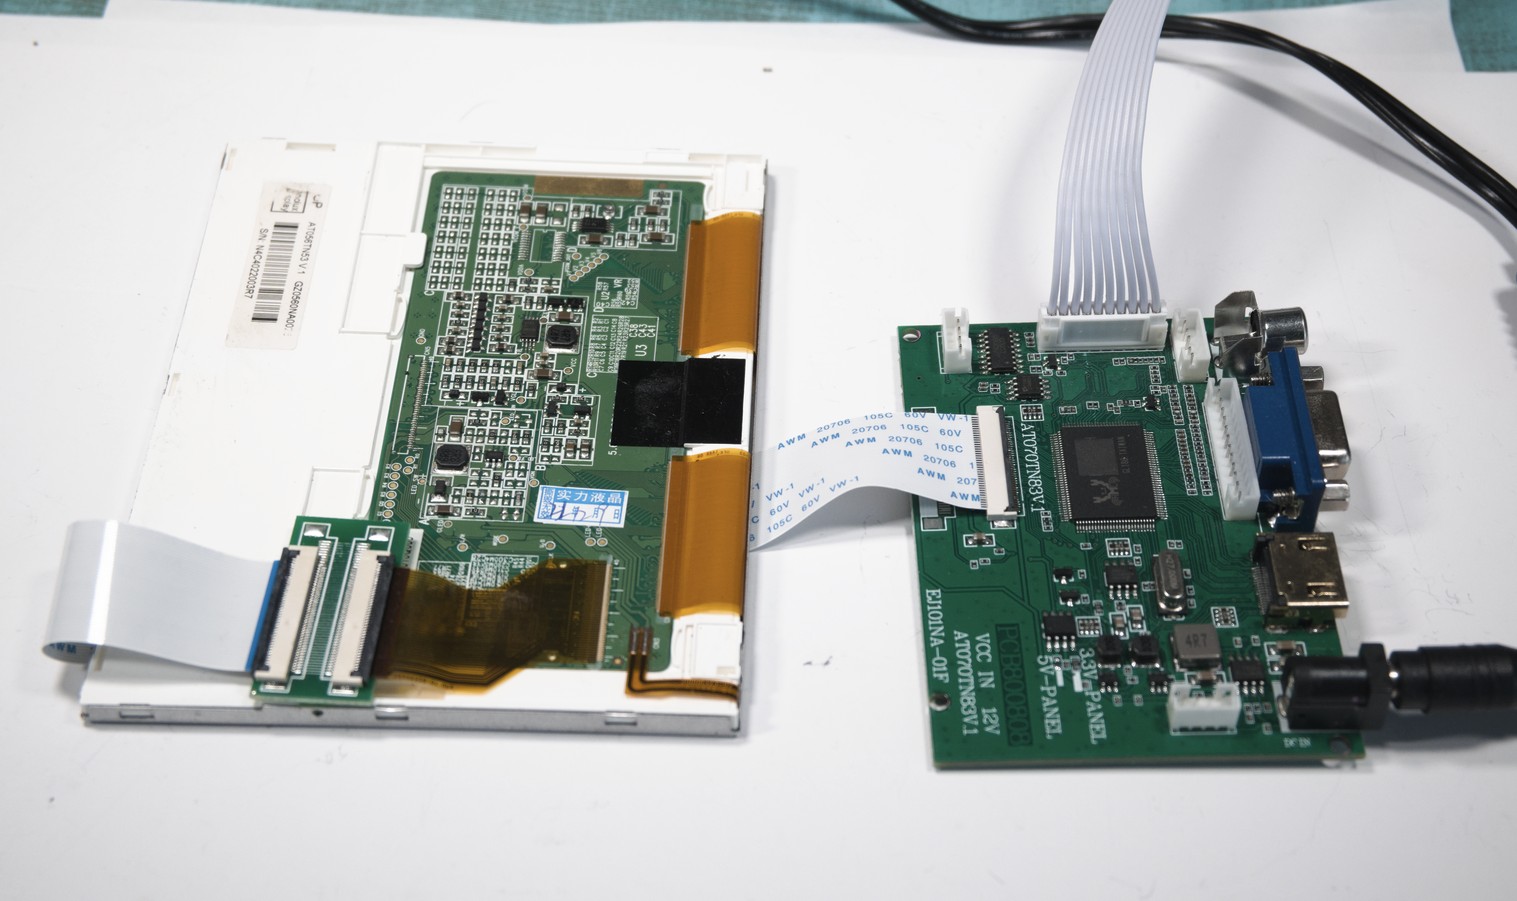
On the bottom-right corner of the PCB behind the LCD panel, there is a small two-way cable. This is where power for the backlight is taken from. Tracing it back across the PCB leads to convenient test-points labelled "LED+" and "LED-", and from there to the LED driver. Typical drivers use current feedback via a resistor in series with the negative output, and that's exactly what I found.
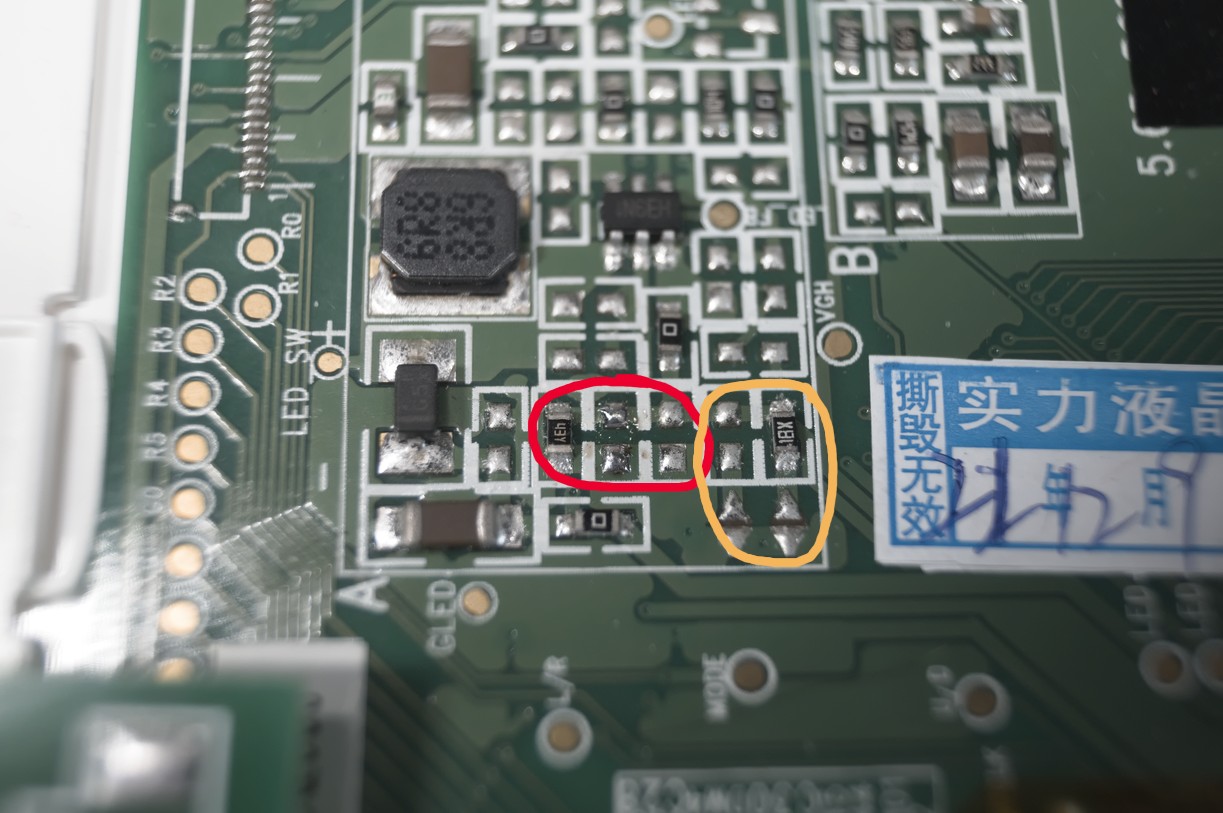
There were two feedback resistors in parallel, one marked "3.0", which is simply 3Ω, and one marked "43Y". That's not 43Ω as you might expect, but a hideous EIA-96 code that means 2.74Ω. I removed the 3Ω resistor, reducing the backlight current by a bit less than half, to something less eye-searing. The photo above is post-modification.
I then turned my attention to mounting the panel. I was able to reuse all the mountings from the old panel, with only a few adjustments. Since there seemed to be some interest in the previous version of this project, I've taken more photos this time, to better show how it's assembled.
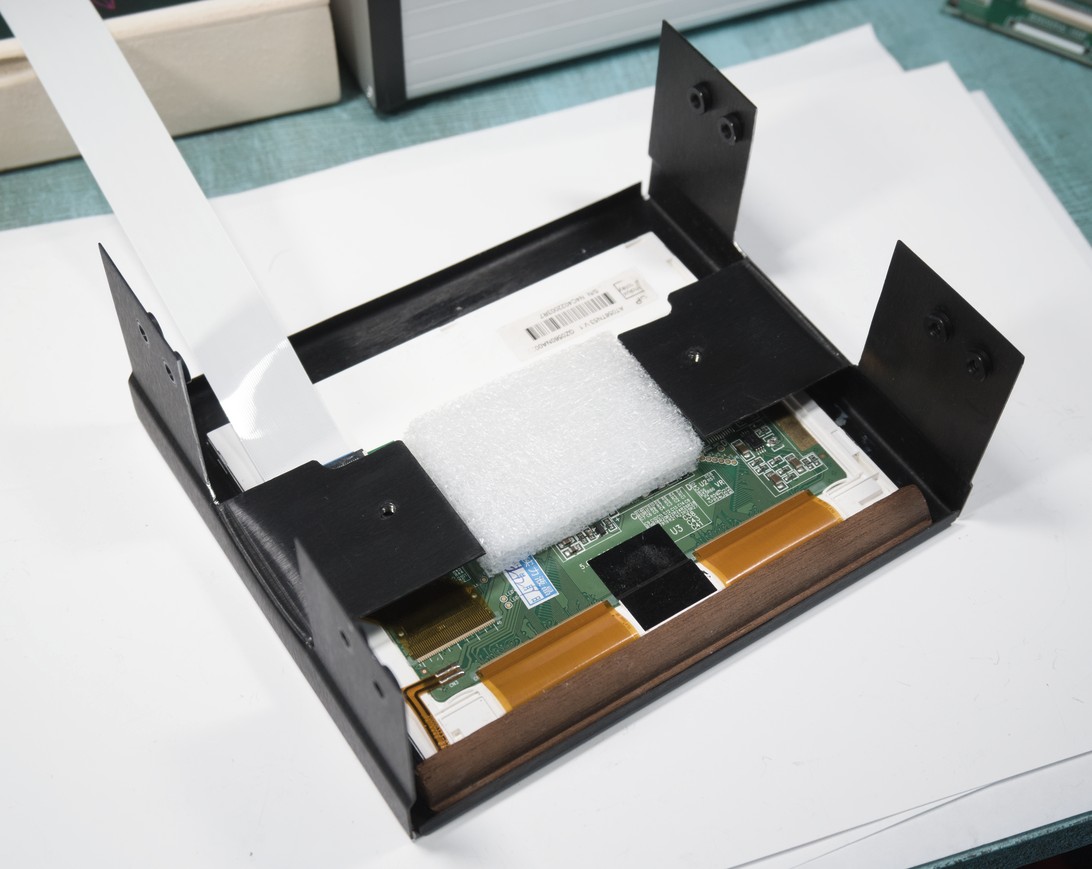
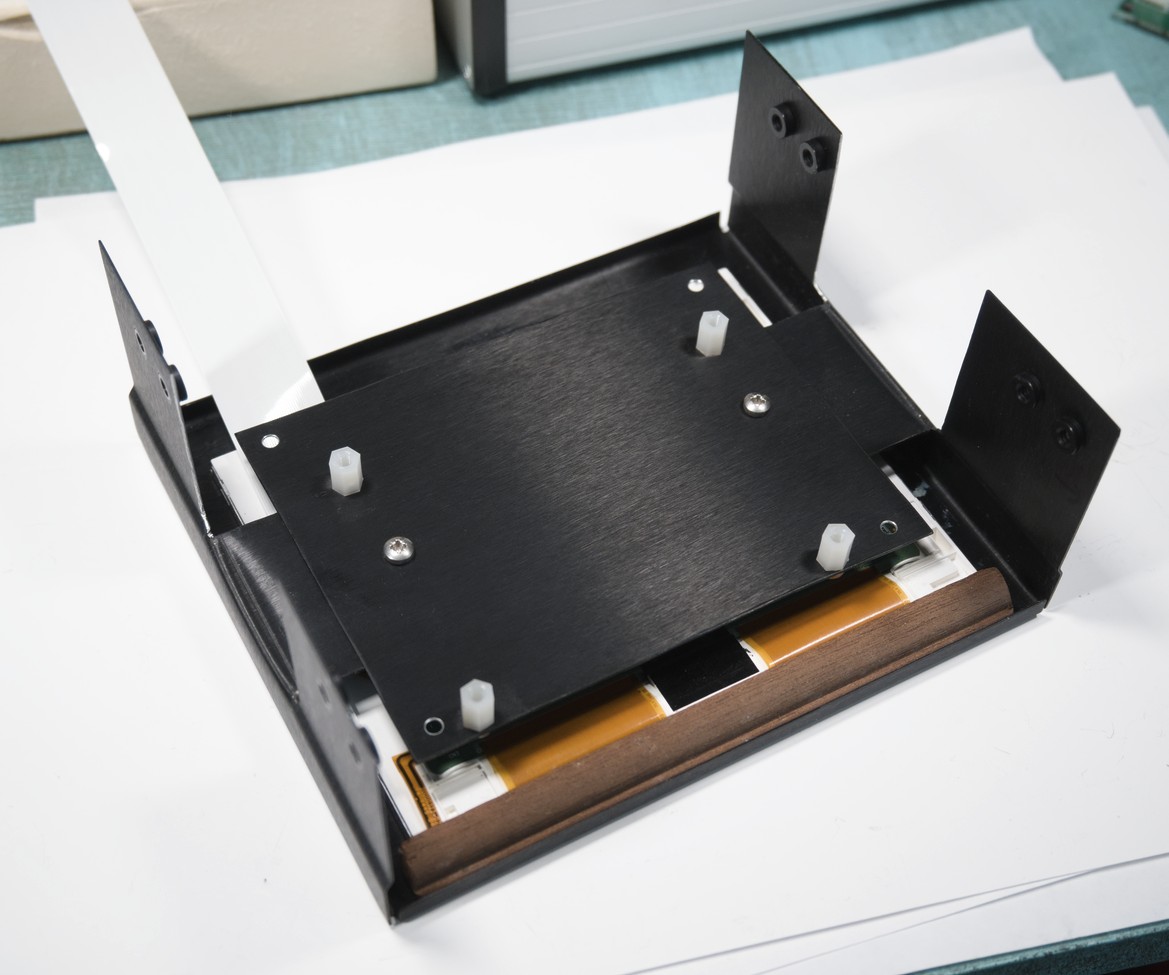
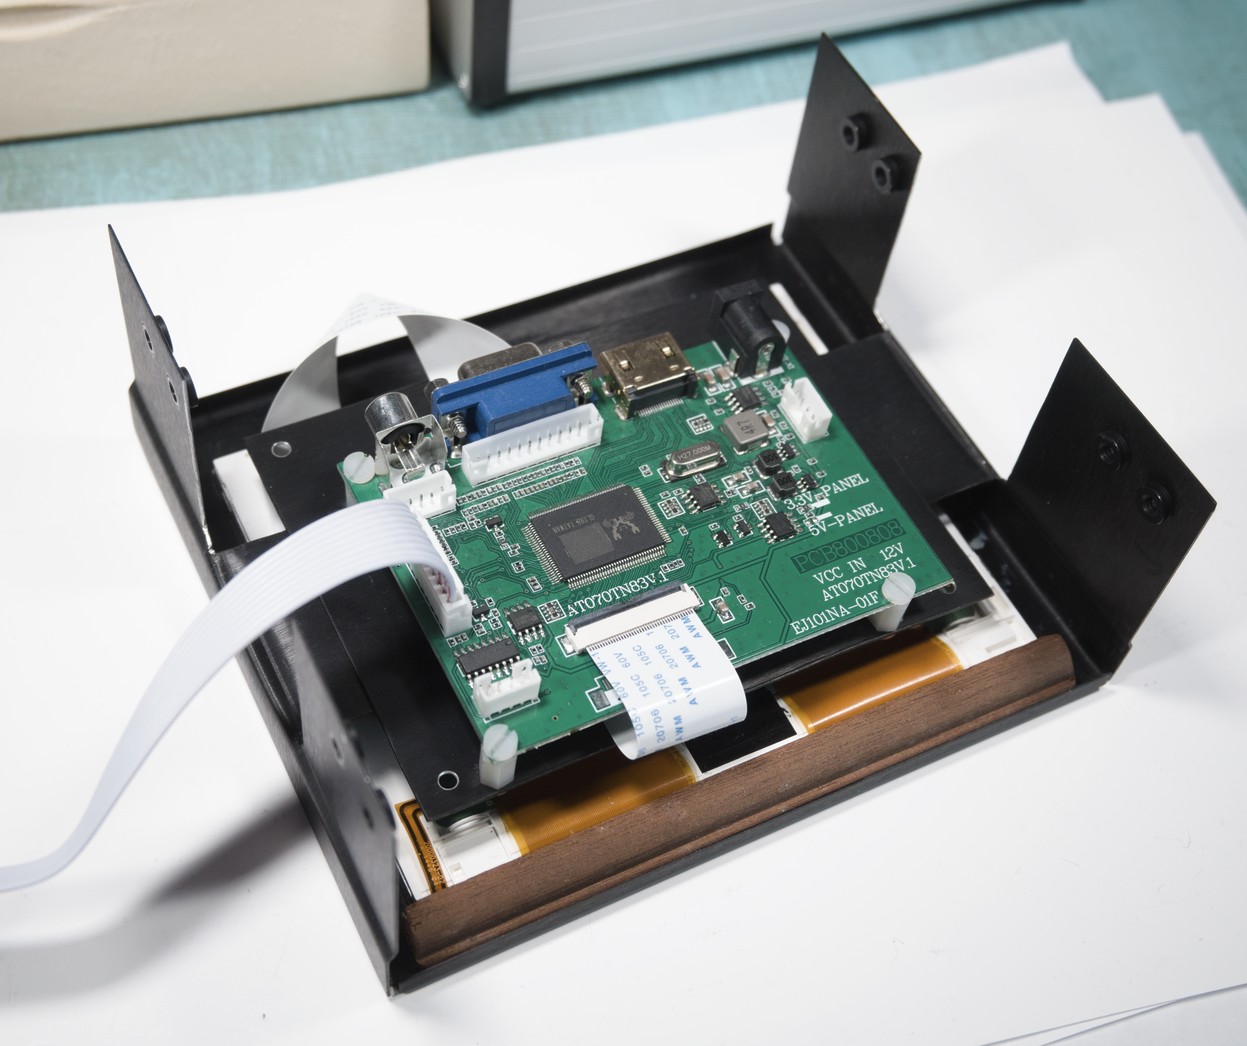
The whole thing it based on a triple 5.25" drive bay cover, with a hole cut out the same size as the active area of the LCD panel. Two sections of the "wings" of the drive bay cover have been cut so that they can be bent parallel to the panel. The panel itself is placed between the front of the drive bay cover and the bent wings. A thin metal plate (actually the bit that was cut out of the front) is then screwed down over it, holding everything in place. The controller board is mounted to the back with nylon standoffs. There's also a strip of wood glued to the lower edge of the drive bay cover that the LCD panel rests on, to stop it sliding down too low.
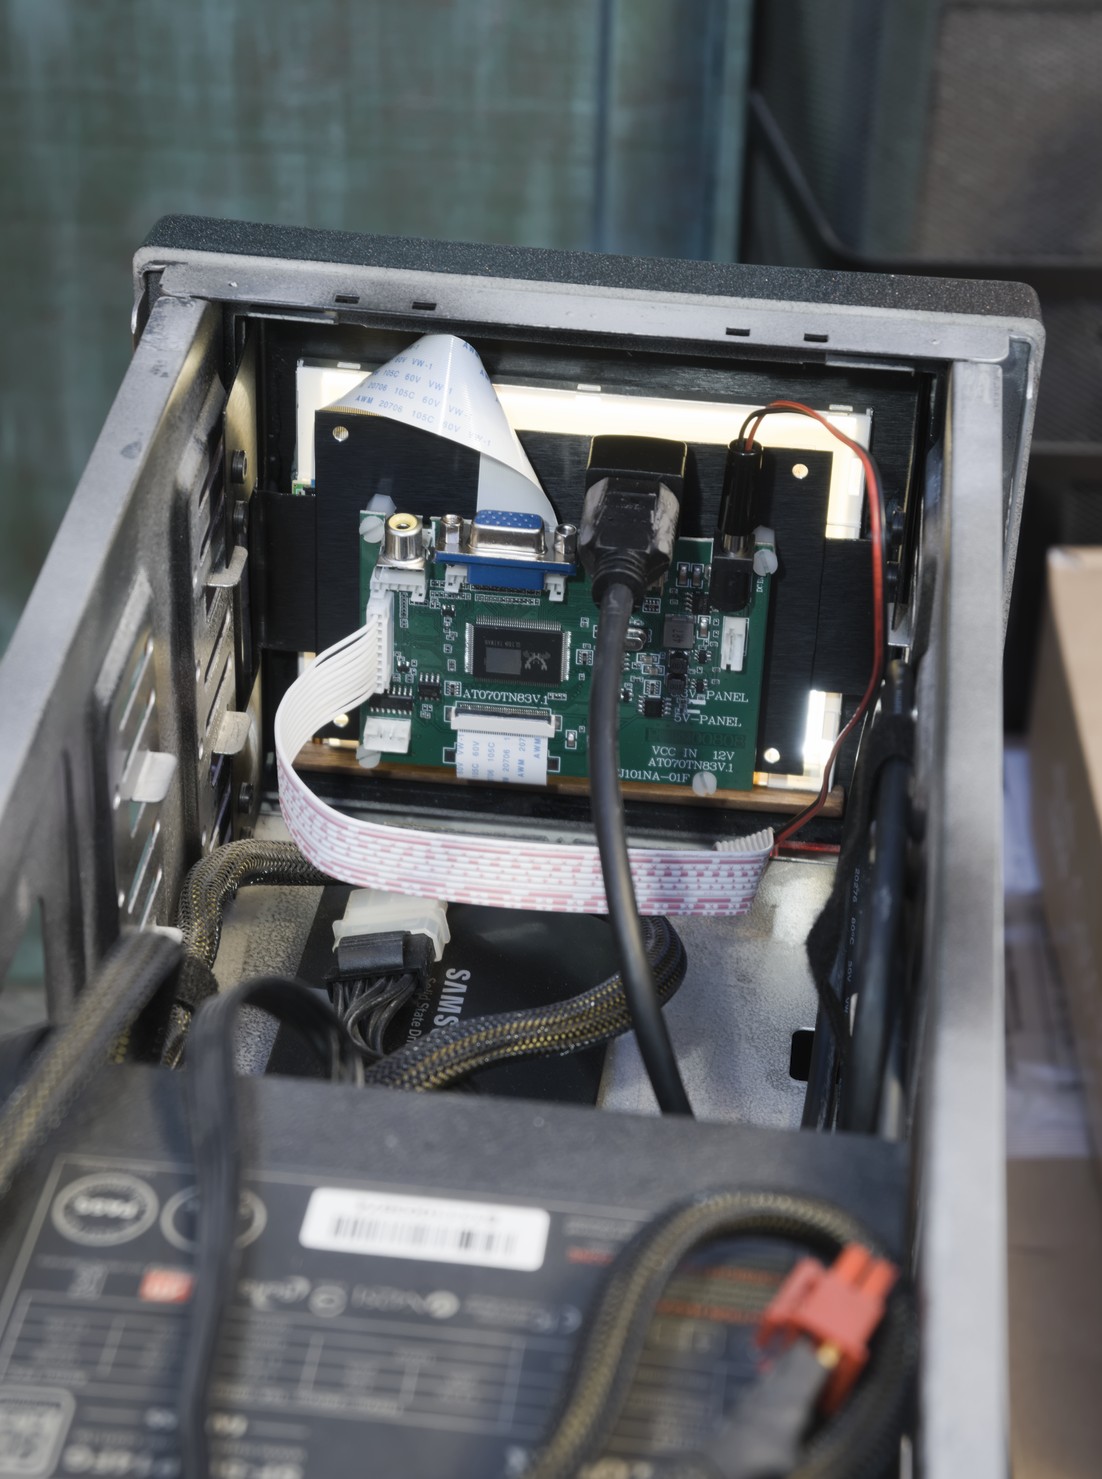
Since the fileserver no longer has any 3.5" hard drives in it, there's plenty of space, which is fortunate because I had to use a 90° adapter to get the HDMI cable to fit, so it pokes out the back, taking up a lot of room. Note that the corners of the HDMI plug have been shaved down so I could shove it through a hole on the back of the case from where the HDMI output is.
The monitor is powered from 12V which is taken from the computer's PSU via an adapter.
There is also a smaller PCB with some microswitches on it for turning the monitor on/off and changing settings. It is conveniently the right size to fit inside a 3.5" drive bay cover.
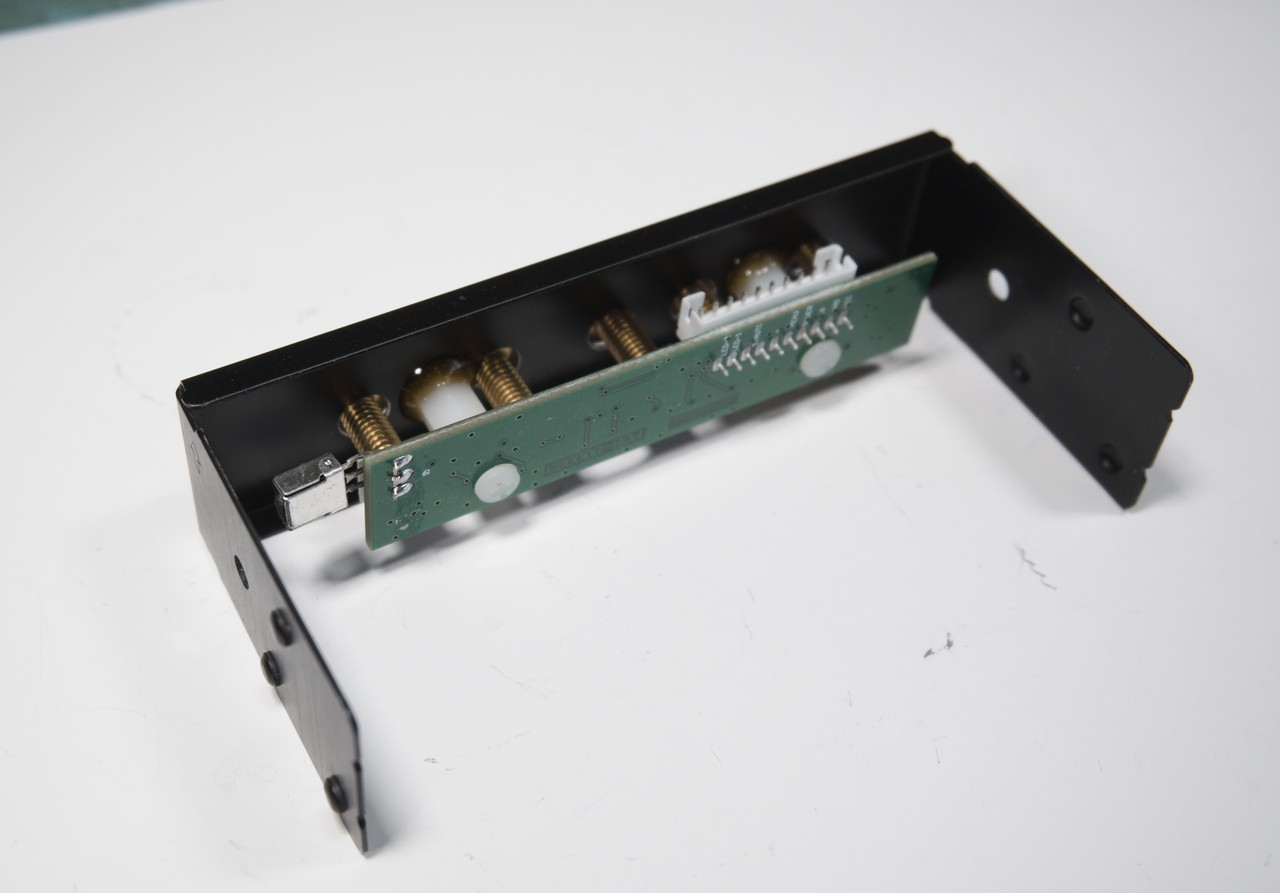

I didn't cut a hole for the power LED because I can tell if the monitor is on/off without the LED by simply looking at the monitor. I also didn't cut a hole for the IR sensor, because the remote control is not useful to me.
Operation

Since it requires a browser to work, FPMon2 uses quite a lot more memory than FPMon1, and a little more CPU too. I think this is worth it, since the fileserver has more RAM and CPU than it needs anyway.
The new monitor is indeed sharper than the old one. I also managed to squeeze out a little more whitespace (blackspace?), allowing the text to be a little larger, making it all easier to read.
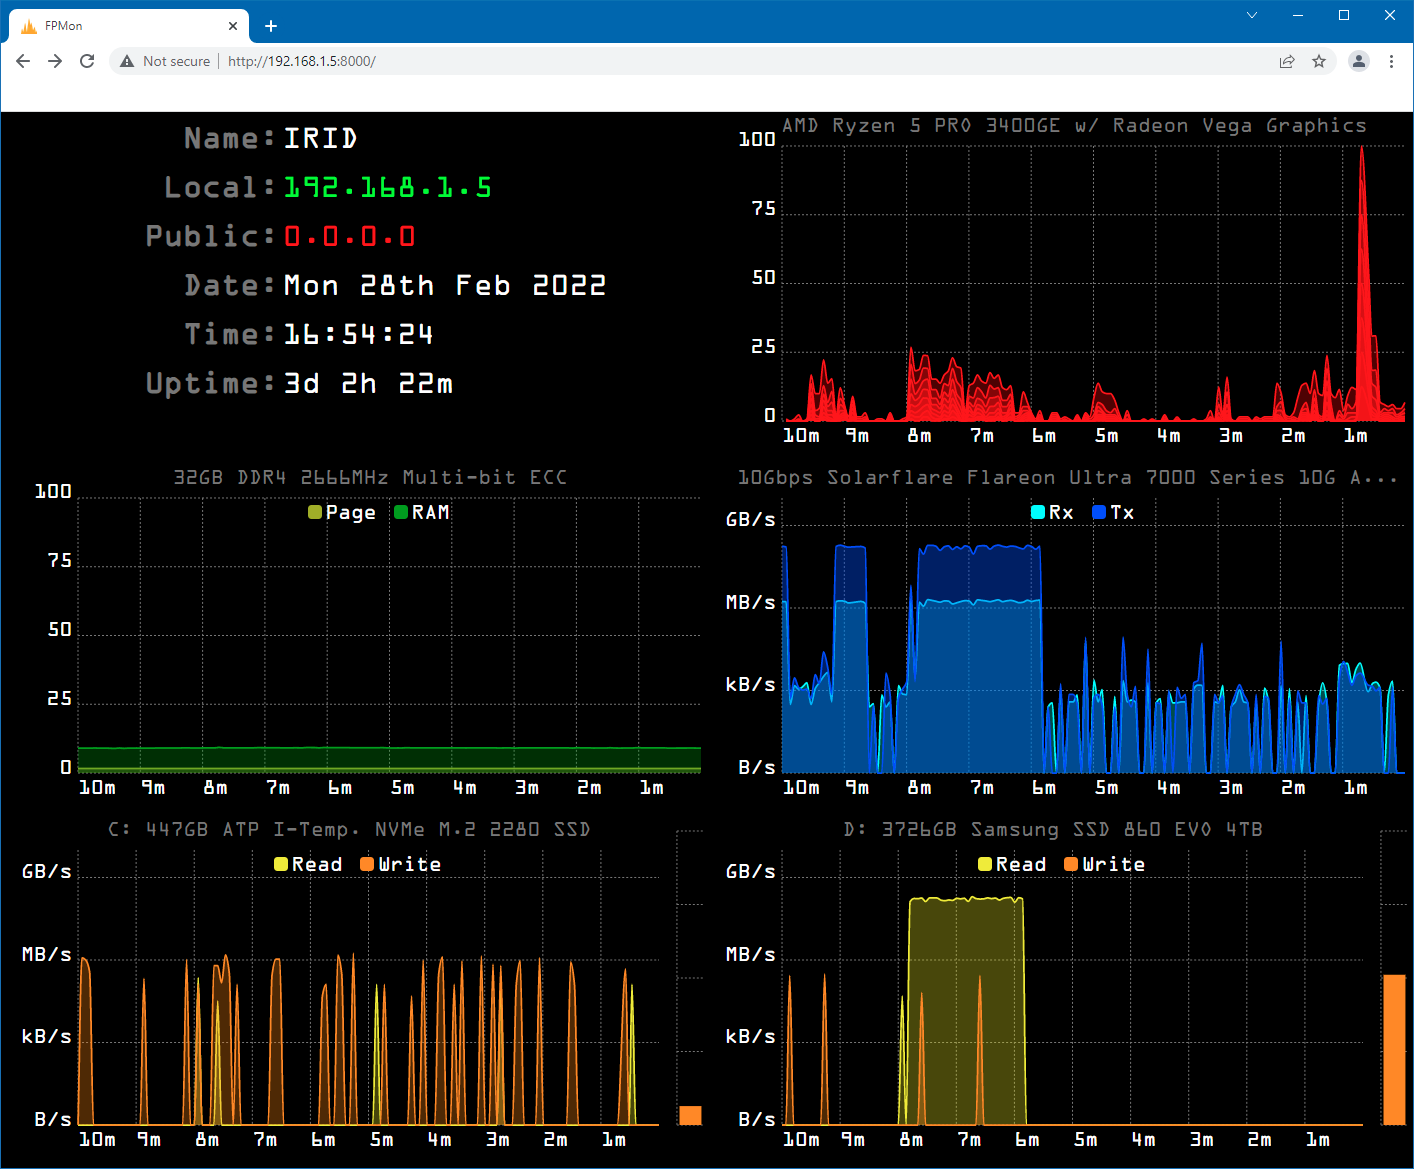
Above is a screenshot of FPMon2 running in a browser remotely. I fiddled with some network settings to demonstrate that the IP addresses turn green when they change, and red when unavailable (which for the public IP address usually means my internet connection is down again). This proved to be a handy feature in FPMon1.
There are a few other minor improvements, such as showing more detail about RAM, network and storage in the chart titles, and adding page file usage to the memory chart.
Note that the network and drive transfer rate charts have logarithmic y-axes. This allows small transfers (like serving this web page to you) to show up while still allowing large transfers (like moving multi-GB files around) to fit on the chart.
If you want to try running the software yourself, you can get it on GitHub, or download it below:
FPMon2.zip (231kB)
To run it you will need to:
- Install Python 3
- Extract FPMon2.zip somewhere.
- Double-click Main.py
- Go to http://localhost:8000 in a web browser.