Computer Related - Testing Coolers
Testing coolers in situ is not very accurate or repeatable because the exact heat output from the CPU is not precisely known (it can be estimated from the datasheet, but measuring it is difficult), and the temperature cannot be measured from the core itself (with some exceptions) It also presents some risk of damage to the CPU from continually removing and replacing the cooler.
Please note that this is not an attempt to simulate real-world performance, but rather of idealised performance, under well controlled conditions, to allow for accurate comparisons of cooler performance. I have tried to be as scientific as possible (unlike most other tests I see on the internet), but if you see any mistakes or have suggestions as to how I can improve my methods, don't hesitate to tell me.
A note on my use of units and notation
Throughout this article I have tried to stick to standard SI units (sometimes called metric). This is a consistent, logical system and is the standard throughout the world for scientific and engineering purposes. It is also the only standard that is still updated as new advances in science require. There are seven base units in the SI system, from which all other units can be derived. The base units are:
| Physical quantity | Base unit | Symbol |
|---|---|---|
| length | metre | m |
| time | second | s |
| mass | kilogram | kg |
| electric current | ampere | A |
| thermodynamic temperature | kelvin | K |
| luminous intensity | candela | cd |
| amount of substance | mole | mol |
I have written units without fractions, like this: °CW-1 instead of °C/W (degrees Celsius per Watt). This avoids possible confusion in long units.
There are a few occasions where I have not used standard units. Firstly, I have used a few non-standard (but generally accepted) units, such as °C (degrees Celsius) instead of K (Kelvin) for temperature. Secondly, if I have not bothered to convert units given for specifications of devices, such as for fans which commonly specify air flow in CFM (cubic feet per minute).
If you live somewhere that still uses an old system, then you will just have to put up with it.
Heat source
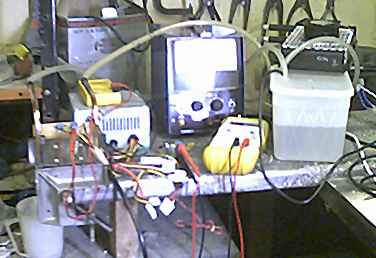
I have constructed a simple test rig that should be able to produce a well defined and repeatable heat load. It consists of an AT power supply, a transistor and a small variable voltage source. It can be used to test water-coolers, heatsinks or anything else. Sorry for the poor quality of pictures - my digital camera does not like the overcast, low-light conditions here at this time of year.
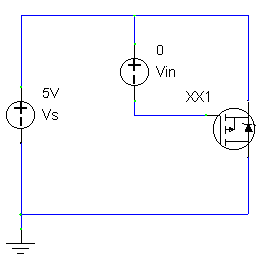
Initially I was going to use a resistor as the heat source, but I couldn't find any of high enough power rating that were of similar size to a CPU die, so I decided to use a transistor instead, which also allows me to vary the heat output by varying a control voltage (labelled 'Vin' on the diagram above) rather than needing a high-power variable supply. A MOSFET is better than a BJT in this case because it's easier to measure the output power, for reasons I shall not explain here.
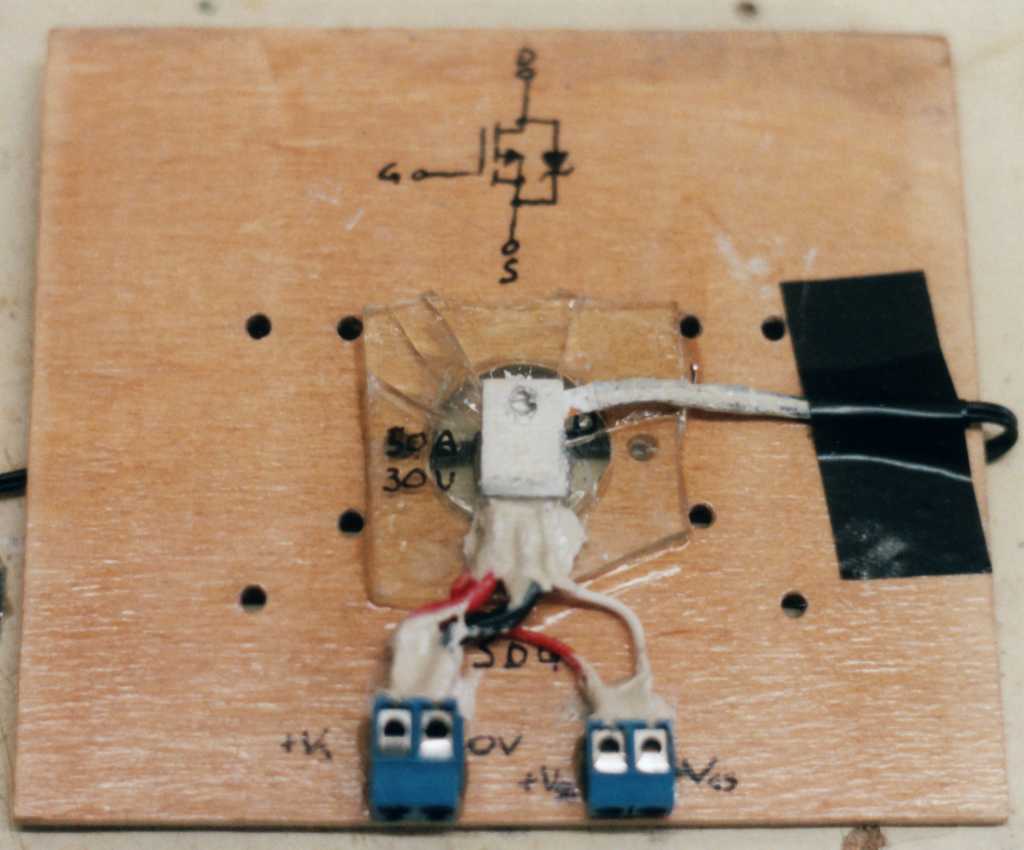
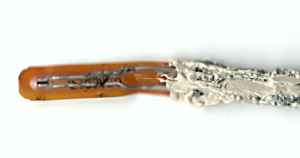
If you're interested, the transistor is an MTP50P03HDL P-channel MOSFET, which comes in a TO220 case. It is rated for 50V/30A and is extremely robust, so it should withstand anything that might happen to it during the testing. The only downside is that its VGS-ID characteristic is very steep (because it's designed for switching applications), thus requiring very fine control of the input voltage (VGS) to control the output current (ID).
The transistor is mounted on a piece of glass about the same size as a Socket-A CPU. I used glass because it has a high thermal resistance and is an almost perfect electrical insulator. This piece of glass is in turn mounted on a piece of plywood with holes drilled in it suitable for both slot and socket coolers. All electrical connections are covered in silicone sealant to protect from accidental spillage (or condensation, if I test Peltiers or anything like that).
Update: The AT PSU couldn't take the strain and kicked the bucket half-way through the testing. I replaced it with a simple unregulated linear PSU, consisting of: A 300VA 8-0-8V toroidal transformer with the secondary windings in series; A bridge rectifier and Two 10000μF capacitors in parallel. This gives 21V DC unloaded, but this drops rapidly under load due to the lack of regulation. Current output is 10A maximum continuous (limited by the rectifier).
Thermometers
To measure the temperature I have two thermistors, which I have left over from my KA7-100 (I don't know why I got two with it) and a multimeter to measure their resistances.
Water cooler
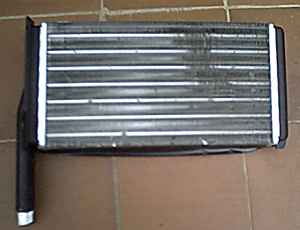
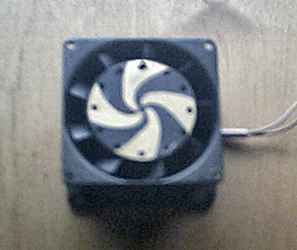
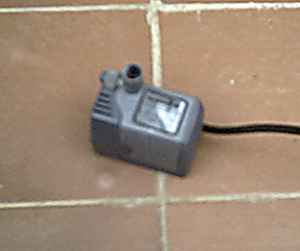
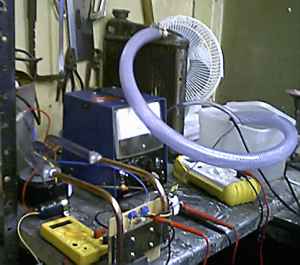
For the initial tests I used the same radiator, pump and pipes that I had on my old water-cooler. The radiator is a heater core from an unknown car. The fan is 2700rpm/28CFM/240V and the pump is a 450l/hr (100Gal/hr) fountain pump. The pipes are 8mm diameter.
For later tests I used a radiator from a Mini and a 200mm/30W desk fan. The pipes were changed to 12.5mm, except the radiator exit pipe which was 25mm.

Calibration
Before doing any testing, the thermistors must be calibrated. For this, the resistance of the thermistors must be measured at two different temperatures. The resistance anywhere between these two points can then be calculated. The obvious points to choose are the freezing and boiling points of water, as they are easy to create accurately, and they encompass a wide enough range of temperatures for my purposes (0-100°C).
Unfortunately thermistors are not linear, so it requires a bit of extra work. The standard formula for thermistor resistance is:
where:
- RT = resistance of thermistor at temperature T in Ω
- RREF = resistance of thermistor at TREF in Ω
- β = material constant in K
- T = temperature of thermistor in K
- TREF = reference temperature
n.b. to convert from °C to K, just add 273.15
This can be rearranged to give:
This is linear, so it is possible to just measure two points, plot them on a graph of ln RT against 1/T and draw a straight line through them, without having to know what β is.
For a temperature of 0°C, I put some ice cubes in some water and left them for a while. This chills the water to just about exactly the freezing point. I put both thermistors into the water and read their resistance three times and averaged them, stirring well before each reading. The average resistance was the same for both thermistors, at 27.8kΩ. The resistance was measured with a multimeter. It doesn't matter if the multimeter is not perfectly accurate, as long as it is linear, and is used for all subsequent measurements. I also used my indoor/outdoor thermometer. It gave a temperature of -0.1°C. Given that it is supposed to be accurate to within 0.1°C, this is just within specification.
For 100°C, I boiled a saucepan of water on the cooker, which unsurprisingly heats the water to its boiling point. I used the same method for measuring resistance as for the 0°C test. The average resistance was 1.13kΩ for both thermistors. I couldn't test my indoor/outdoor thermometer as it won't go as high as 100°C.
Plotting these on a graph gives:
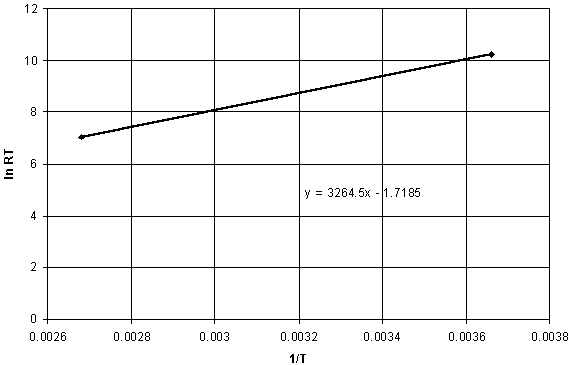
Excel has handily drawn a line of best fit and an equation for it (y≡RT and x≡1/T), saving me the bother. From this it can be seen that:
Note that T is in Kelvin.
As a quick test that this is not wildly out, I measured the resistance of both thermistors at room temperature (in air), which was shown as 21.0°C by my indoor/outdoor thermometer. The thermistors had resistances of 11.80kΩ and 11.81kΩ, which from the above equation gives temperatures of 21.10°C and 21.08°C. This suggests that the calibration has been successful. It also tells me that the indoor/outdoor thermometer is out by a constant -0.1°C (between 0°C and 21°C).
n.b. Some thermistors show a variation in β with temperature, which would mean the above graph is not quite linear. Unfortunately I do not have datasheets for my thermistors, so I don't know if this is true of them or not. However, the error arising from this should be small enough to be ignored for my purposes. I am also aware that measuring the thermistors resistance will itself warm them up slightly, but again this effect should be small enough to be ignored.
Testing
Initially I used a well-proven old custom waterblock to get a reference point for performance. The transistor was initially set for a power output of about 25W (the AT PSU seemed to have trouble supplying much more). One thermistor was placed just behind the metal tab of the transistor, with a dab of thermal paste. The other was placed in the reservoir. Initially I had the second thermistor inside the inlet pipe of the waterblock, but after a bit of testing it seems that the water temperature there is indistinguishable from that in the reservoir, so I chose the reservoir as it is easier to get to and it has less effect on flow rate. Ambient temperature was measured by the indoor/outdoor thermometer, placed just below the radiator (air is sucked up by the fan on top).
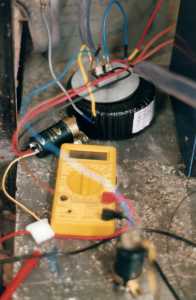
Current was measured using a spare multimeter (visible on the left in the pictures below). Voltage and thermistor resistances were all measured using another multimeter (the one on the right).
For the temperature to level off took about 30-40 minutes, so I waited for 1 hour to be sure.
I have assumed that absolute temperature makes no difference, so I have made no attempt to control ambient temperature, which varied by several degrees over the course of the tests, but was almost constant for the duration of each individual test.
Before I start, I should say that the placement of the thermistor behind the metal tab measures the thermal resistance of the waterblock and the thermal paste and the metal tab all in series. To avoid long-windedness I shall simply refer to this thermal resistance as the waterblock's thermal resistance. to get the thermal resistance of the waterblock alone, the thermal resistance of the thermal paste (estimated below) and the metal tab (approximately 0.075°CW-1, calculated from the thermal resistance of copper and the dimensions of the tab) must be subtracted.

The first test gave a thermal resistance of 0.74°CW-1 for the waterblock, and 0.14°CW-1 for the radiator.
The radiator's performance is exactly as I expected - about 3 times worse than it was when used on my CPU because the fan moves about 1/3 of the air of the 120mm fan in my case.
The performance of the waterblock however seems very bad compared to what I measured on my CPU, even considering the different placement of the thermometer (when it was on my CPU, I was measuring from a point close to the waterblock itself, bypassing the thermal paste mostly), so I made a list of all the differences I could think of between my test setup and the real CPU:
- Different thermal paste
- Lower power
- Waterblock orientation
- Ambient temperature lower
- Smaller fan on the radiator
- Thermometer placement
- Orientation of heat source (a compromise I made to make it easier to wire it up)
- Different surface area (no shim in the test rig)
Thermal paste: To eliminate the first variable I simply changed thermal paste (initially I didn't want to waste the expensive stuff on testing!) from silicone-based to Arctic Silver II. This lowered the thermal resistance of the waterblock to 0.63°CW-1 - an improvement of just over 0.1°CW-1. This figure allows an estimation of the thermal resistance of the interface between waterblock and transistor, knowing that AS II is about 10x the thermal conductivity of silicone based paste: Silicone paste ≈ 0.11°CW-1; AS II ≈ 0.01°CW-1. Note that these are approximate figures.
As you can see, this still leaves the thermal resistance of the waterblock an order of magnitude higher than I had measured on my CPU, so more testing is in order. I did not change the thermal paste back afterwards, so it is AS II for the rest of these tests.
Power: I couldn't get the AT PSU to supply as much power as my old Athlon (about 60W), so instead I tested over a range of power levels to ensure that the measured thermal resistance did not change (any change would indicate an improper setup). I made several tests at power levels from about 10W to 32W. The thermal resistance I measured varied by no more than 2%, showing that the thermometer placement is good, i.e. they are directly in the main path of heat flow. It was at this point that the AT PSU conked out and I changed to the linear PSU, which can supply more than enough to simulate any CPU, so I did another test at 60W. As expected this gave no significant change in measured thermal resistance.
Waterblock orientation: I almost didn't want to test the third variable (waterblock orientation) because it seemed so silly, but I must rule out everything so I tested it anyway. I turned the waterblock so that it was the same as it was on my CPU - with the water entering at the bottom, flowing up over the heat source, and then leaving at the top. To my surprise, the waterblock + paste's thermal resistance came out at 0.58°CW-1, significantly lower than the horizontal position! Why is this? I don't know for sure. The only thing I can think of is that the flow resistance is lower when vertical because the water heats up as it flows through the waterblock, reducing in density and thus preferring to rise upwards. But this effect must surely be too small to account for the difference. I may test this later by reversing the flow. If anyone can enlighten me, please e-mail me. I returned the waterblock to horizontal position for the rest of the tests.
Ambient temperature: To change ambient temperature I just shut the workshop door, and after a while the temperature increased to about 20°C, which is comparable to the temperature in my room. This made no difference to the measured thermal resistance.
Radiator efficiency: To test the effects of radiator efficiency on waterblock efficiency I replaced the heater core with a radiator from a Mini and a desk fan. This combination has both higher surface area and air-flow than the previous setup. First, I did a test with the fan off, to see how well the radiator would do using natural convection. The radiator was stood vertically, which is not optimal for convection but since the top is not sealed I have no choice. The thermal resistance of the radiator like this was 0.093°CW-1. Then I switched the fan to maximum, giving a thermal resistance for the radiator of 0.018°CW-1. For both of these tests the thermal resistance of the waterblock + paste came out to be 0.61°CW-1, which is slightly less than before, and may be due to increased flow rate caused by the larger radiator (it has many more parallel paths for water to flow through compared to the heater core).
Thermometer placement: To check the effect of thermometer placement, I repositioned the thermistor so that it was touching the junction between transistor and waterblock. From this I got readings several degrees cooler than from behind the metal tab of the transistor. If I try to use this figure to calculate thermal resistance I get a figure of 0.44°CW-1 (this is not a valid measurement of thermal resistance, demonstrated by the fact that it is not constant with varying power, but I have included it for comparison) This shows that this is not a good place to measure the temperature, and it accounts for some of the discrepancy between results in the test setup and on the CPU.
Orientation of heat source: I can't reorient the transistor without rebuilding the test setup, so I decided to skip this test unless it proved absolutely necessary. The transistor is rotated 90° compared to an Athlon core, so that its longest dimension is vertical instead of horizontal. Because both the transistor and an Athlon are both fairly close to being square I assumed that this would not make too much difference.
Surface area: The surface area of my Athlon was effectively increased by the use of a copper shim. This spacer dropped the measured temperature of my Athlon by about 5°C (for the copper version), and in retrospect I should have realised that this was enough to make comparisons between the original test setup and the CPU invalid. I can't use a shim as such on the test setup because the transistor is too high off the glass base, so instead I used a solid sheet of copper placed between the transistor and the waterblock. With this setup the measured thermal resistance was 0.43°CW-1. This is surprisingly large drop of 0.2°CW-1, and suggests that future waterblocks of this design should have thick, copper bases. I then tried moving the thermistor to a point where the shim contacted the waterblock, which is approximately where I took measurements on my CPU, and almost inevitably I got a temperature that suggested a thermal resistance of less than 0.1°CW-1 (once again, this is not a valid measurement of thermal resistance) which is in line with what I had measured on my CPU. This, unfortunately, shows that my previous estimates of the performance of my waterblocks were wildly out, but I have learnt much by my mistakes.
After this I wanted to find out a bit more about the effect of flow rate. I measured flow rate by timing how long it took to fill up a measuring jug to the 1l mark from the exit pipe of the radiator (probably not very accurate). Since I only have one pump, I increased the flow rate by increasing pipe diameter from 8mm to 12.5mm, except the exit pipe from the radiator which went up to 25mm (this was necessary to stop pressure from building up inside the radiator and pushing water out of the filling hole in the top!). The 8mm pipes gave a flow rate of about 42x10-6m3s-1 and the 12.5mm pipes a flow rate of about 56x10-6m3s-1 - an increase of 33%. It is interesting to note that these figures are less than half of the rated flow rate. I presume that the 450l/hr specified is with no load on the output, and it is the pipes, waterblock and radiator which slow the flow so much.
The thermal resistances with the larger pipes were 0.60°CW-1 for the waterblock and 0.017°CW-1 for the radiator (with fan on full). Both are slightly lower than before, but only just bordering on significant. It seems that increasing flow rate, even by a large 33% has only a minimal effect on my setup.
Conclusion
I think I have enough evidence to say that the test setup is a valid and accurate way of measuring thermal resistance. I did some tests many times and the values I obtained varied by no more than ±0.1°CW-1, which I think is quite impressive.
It is obvious there is a lot of room for improvement in my waterblock designs, which is of course why I built the test setup in the first place. Moving from brass to copper should make a big difference.
Changing from the small heater core to the large Mini radiator made a worthwhile difference, and also shows that a large enough radiator can be efficient enough with natural convection to be used with high heat loads, for a silent computer.
I think I have also proved that I am completely insane - spending hours doing these experiments, and then writing pages about it, all just for 'fun'! But if you have read all this then you probably understand.
Now I am ready to use this to help me design a new Socket-A waterblock; If I can find somewhere that sells blocks of copper that is.