Weather Station
My indoor/outdoor thermometer stopped working properly, and I thought it would be nice to replace it with a device that could also measure humidity, since that has a strong effect on how hot or cold it feels. However, most of the commercially available ones are either of dubious quality, or have absurdly overcomplicated displays. Why would I buy something like that when I can build one of equal quality myself, with a display just as complicated, and for no less money?! It's also a good excuse to buy another Raspberry Pi, since version 3 became available earlier this year with built-in WiFi, which should ameliorate the biggest problem in getting them networked.
Sensors
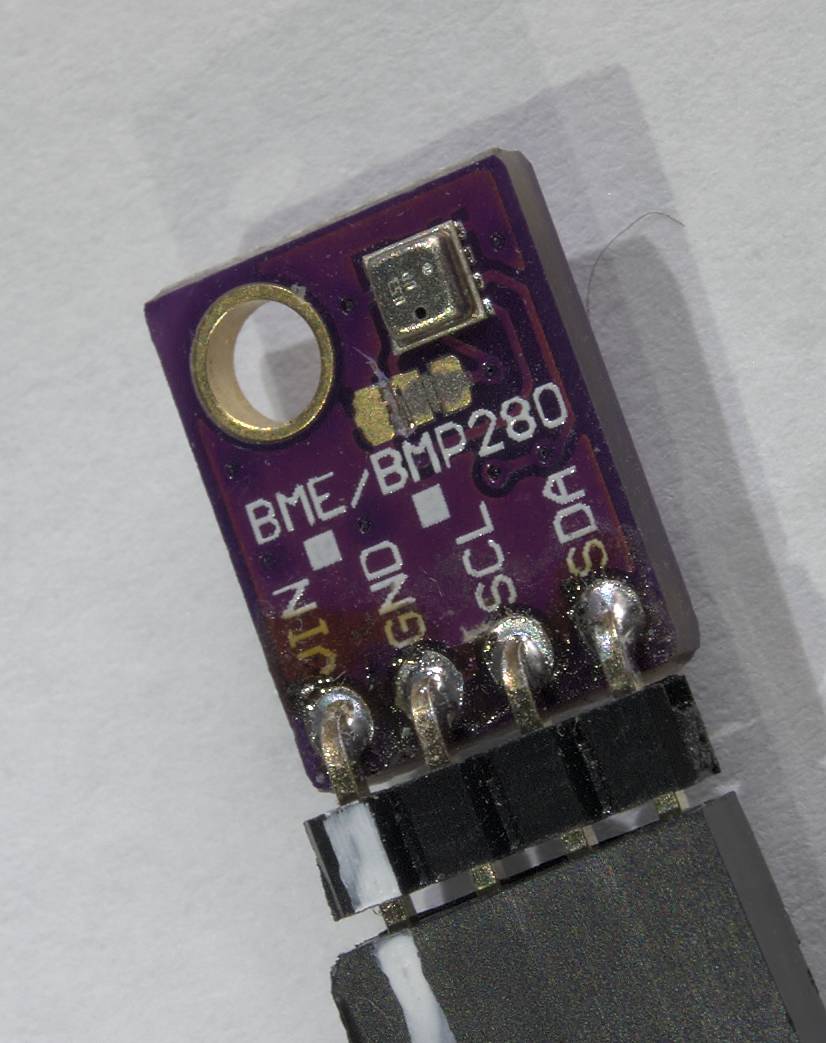
Raspberry Pis have a standard I2C bus, and there are lots of I2C sensors available. To keep things simple, I chose to use a couple of BME280s, which combine temperature, humidity and pressure (feature creep is a good start to a project) sensors into a single package only a couple of mm in size. They are available as modules with the sensor and supporting circuitry on a tiny PCB, which is good because soldering one by hand would be impossible.
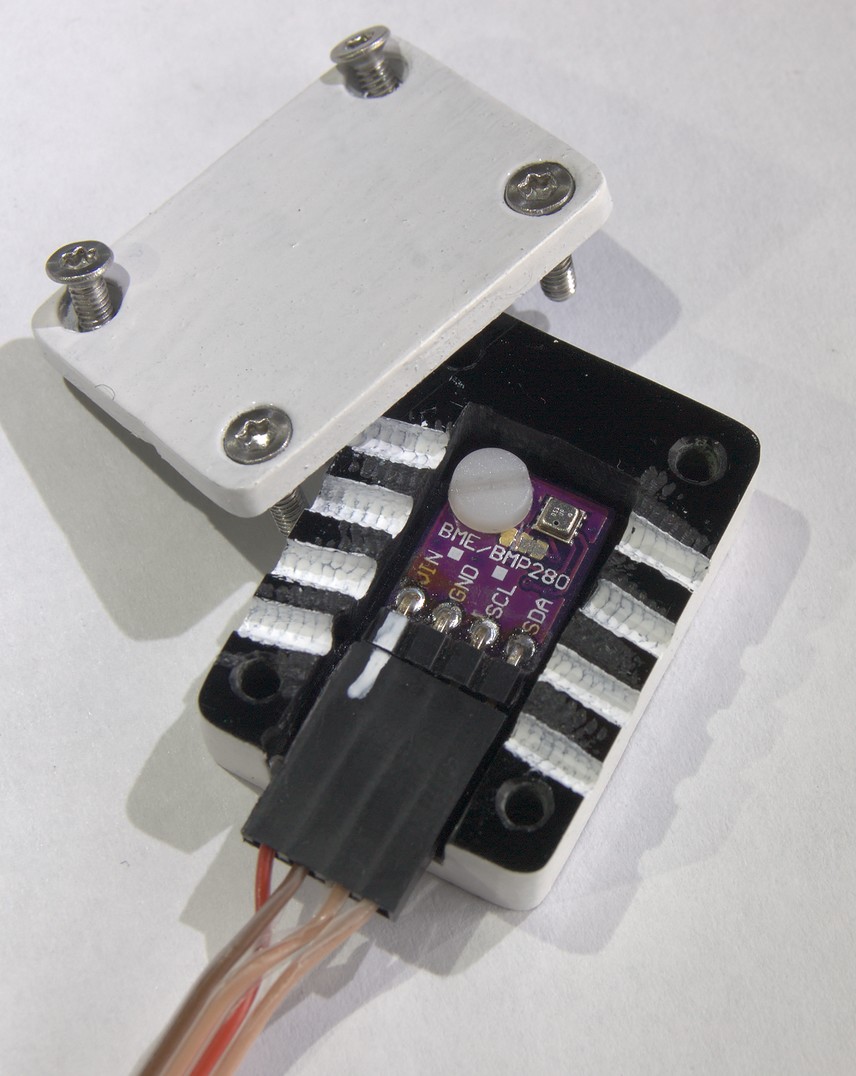
For use outdoors, the sensor needs to be protected from wind, rain and sunlight. To accomplish this I constructed a small enclosure out of acrylic. The enclosure should be white to reflect light, but I only had black acrylic, so I painted it. I drilled some holes in the sides to improve airflow. It is mounted about 1m away from the Pi, which is quite a long way for I2C, so I used twisted-pair cable, twisting Vdd with SDA, and GND with SCL. This helps to keep noise off the bus, allowing it to work reliably over this sort of distance. If it was even further away then it might have needed shielding too, or more ground wires.
Display
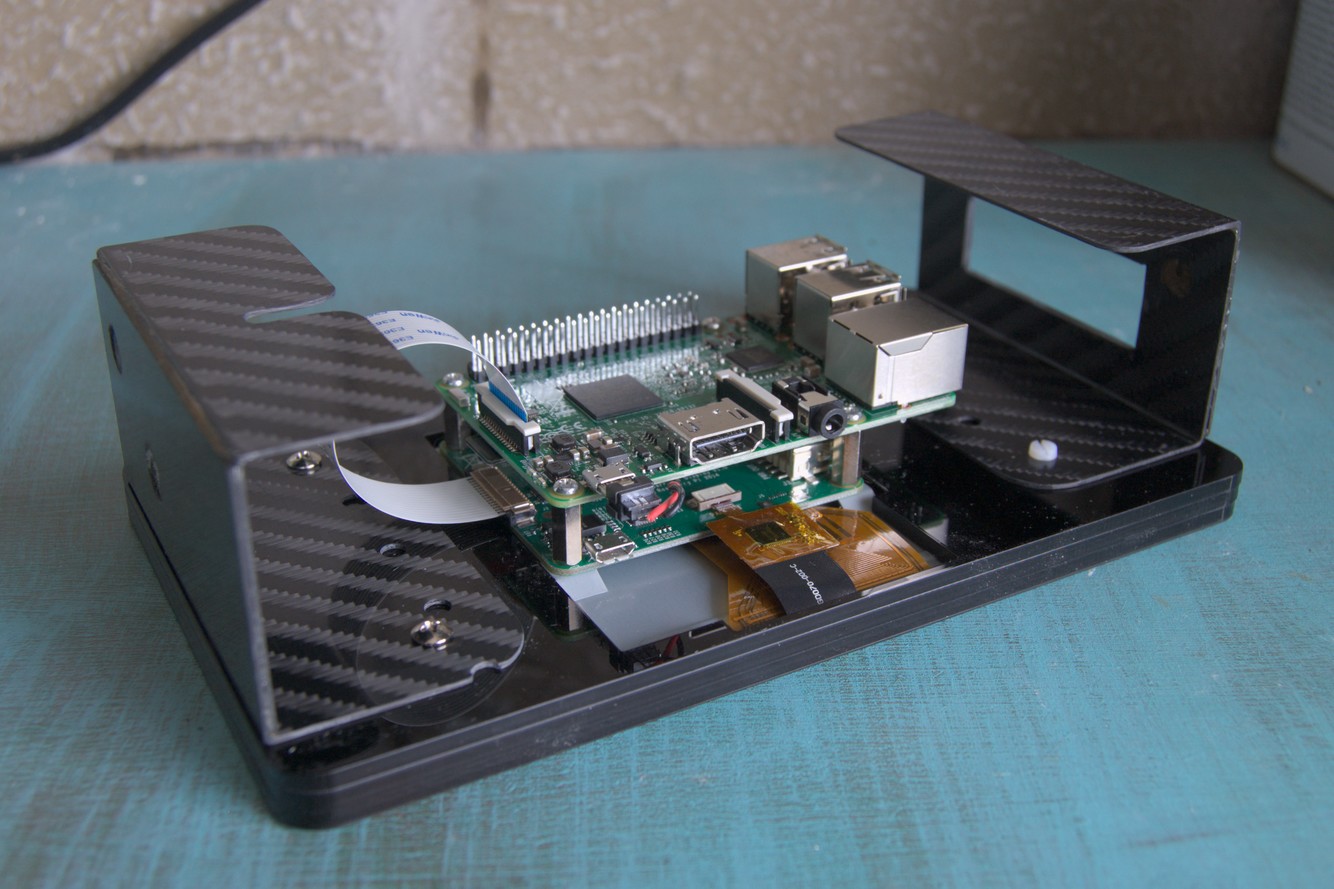
Since an official and quite nice looking touchscreen has been made available for the Raspberry Pi recently, I bought one to try it out. Although touch input isn't necessary just to show temperature, I could make use of it to add a few gratuitous features. The display screws neatly to the Pi itself, and has some extra holes on the back that can be used to mount it to something - a wall in this case. To mount it I made a couple of brackets out of some scraps of carbon fibre that I had lying around (which is why the brackets have some extraneous holes in them). The black acrylic that covers the rear of the display is part of a Pimoroni case that was sent to me along with the display itself. This wasn't really useful, but it does look a bit neater than the bare metal underneath. There were some other parts of that case that were not required at all, but I made use of them by recycling them into the sensor enclosure.
Software
The software is divided into three parts: The web server (written in Python), the bit of the server that reads the sensors (also Python), and the client (a web page written in JavaScript, which is displayed on a web browser that runs on the Pi, and can also be viewed from any other device with a web browser on my local network). Like my last Raspberry Pi project, I used WebIOPi for the web server rather than writing it all myself. It provides support for reading sensors on the I2C bus too. Also like the last project, I modified WebIOPi to support more HTTP verbs (since having to use POST for everything is not convenient). This time I also added support for GZIP compression, since this project involves sending quite a lot of data to clients over a relatively slow WiFi connection. If you want to see the changes I made, you can download the modified source code below:
Weather_Station_WebIOPi.zipWebIOPi doesn't come with support for the BME280, so I wrote a driver for it. It was fairly easy to write because the datasheet has code samples for the important parts (in C, but easily translated to Python). You can download it here:
BME280_driver.zipGiven that I have a whole 7" display to fill, but only figures from three sensors to fill it, I took the next step and charted the values over time. The server reads the sensors once a minute and stores the values in a SQLite database, then sends a whole bunch of readings at once to the client. On the client side I used Chartist.js for the charts (which isn't the most feature-complete charting library available, but is very well written). To make use of the touchscreen, the time period that the charts show is selectable. You can download the server and client code below (the copy of Chartist.js it contains has some optimizations I made to speed it up when drawing a chart with >1000 points [1 point per minute for a whole day]):
Weather_Station_client+server.zipResults
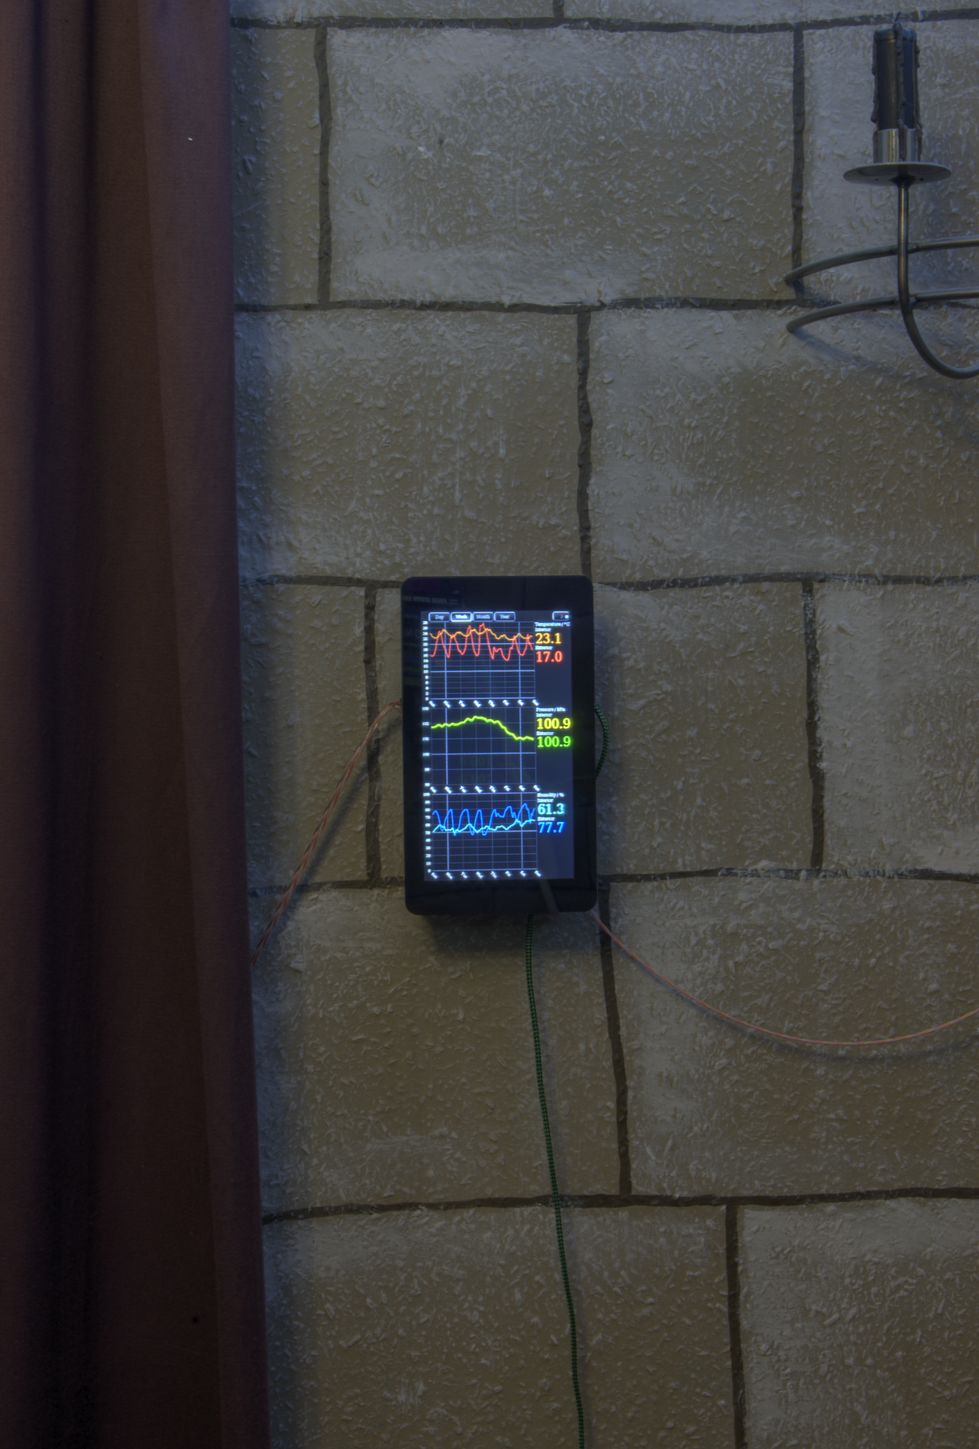
Charting the values lets me know if I should expect to encounter ice when I leave the house in the morning, and gives me some idea of what the weather is going to be like for the rest of the day, so it's not entirely frivolous complexity. You might notice the extra button in the top right corner. This puts the display into power saving mode, so I can turn it off at night. I wanted it to turn off the status LEDs on the Pi too, but on the new Raspberry Pi 3, the power LED can no longer be turned off (an unfortunate side-effect of the built-in WiFi). I simply covered the LEDs permanently with a bit of tape instead.
Pressure is normally measured in hectopascals (or the equivalent millibars). I used kilopascals instead because then the y-axis labels only need to be three digits long instead of four. The indoor/outdoor pressure values should be identical, but actually differ by a small amount. This is due to the sensors not being perfectly accurate. There are similar discrepancies in temperature and humidity, but those are masked by the much larger real difference between conditions inside and outside.
Here are some screenshots, giving a better view of the actual data, starting with the time scale set to one day.
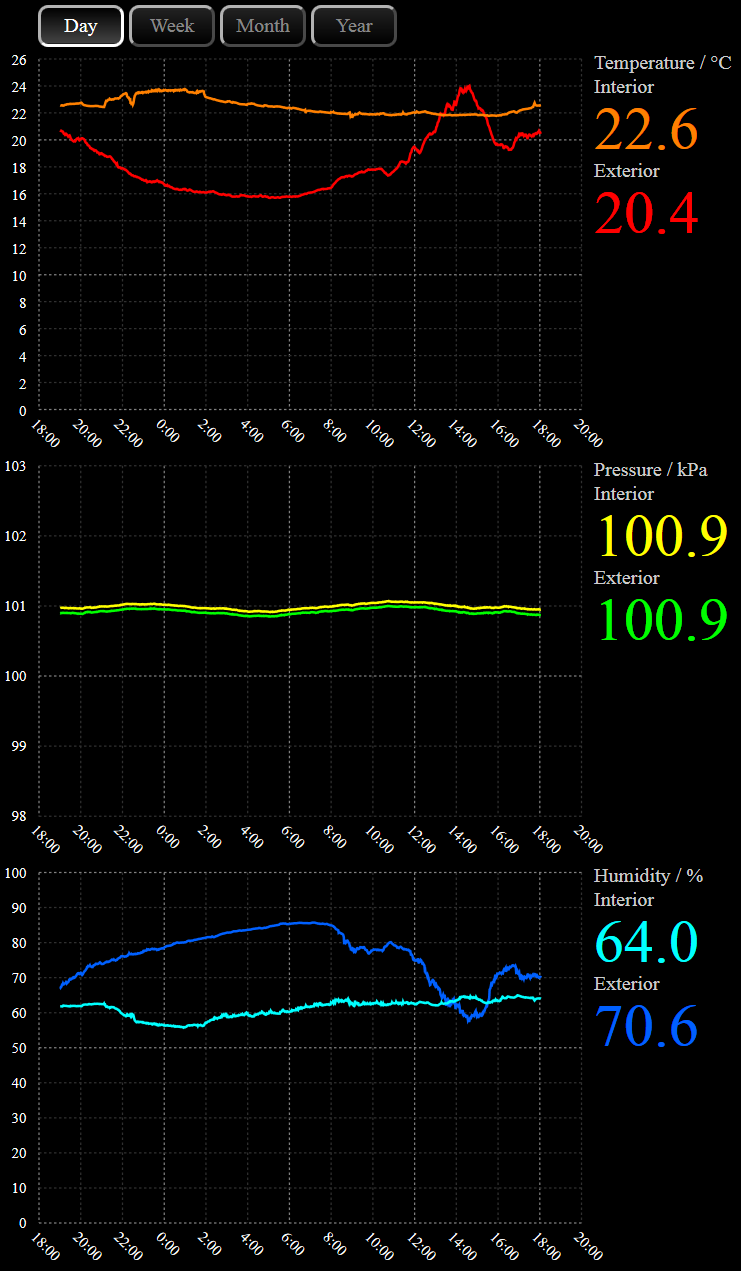
On this particular day, the outdoor temperature rises steadily in the morning and early afternoon, then drops sharply at about 14:30, corresponding with when it clouded over and started to rain. Short-term variations in indoor temperature reflect what's going on in the room (the presence of people and how much work the computers in the room are doing), and the opening of windows and doors. Humidity is highly correlated with temperature. The pressure doesn't change much over short periods like this.
Viewing the data for a whole month makes the consistent day/night cycle more obvious.
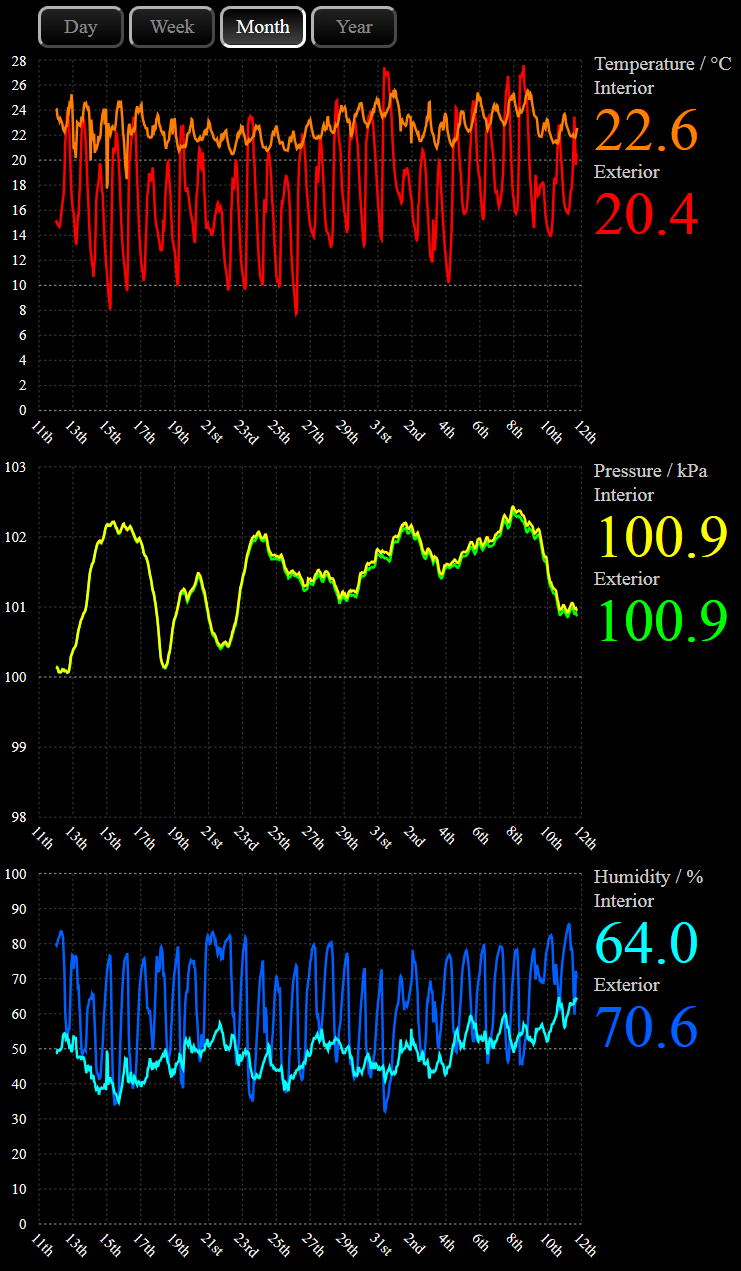
Even though the indoor temperature doesn't change much with outdoor temperature on the scale of one day, here you can see how it does follow outdoor temperature over the longer term. On some mornings there is a peak in temperature, which is caused by the sun heating up the side of the house where the sensor is mounted, even though the sensor enclosure is not in direct sunlight.
It hasn't been running long enough for the year view to be meaningful. I might update this page with a screenshot a year from now.Yet more patterns are revealed in the year view, which plots the daily averages.
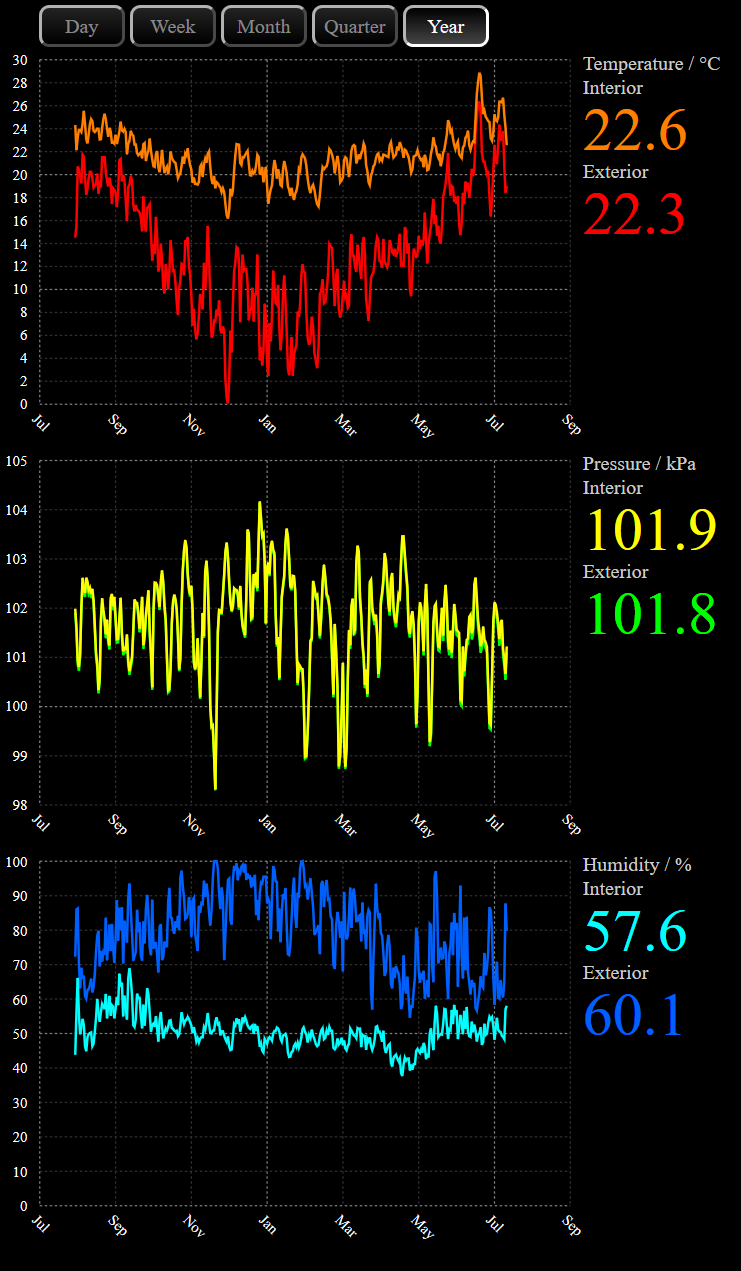
Teperature is of course lower in winter, and humidity is higher. The variation in indoor humidity decreases in the winter, coinciding with when it becomes cold enough that the windows are kept closed. Pressure seems to be higher in winter, as well as more variable, but I don't know if that is typical. The biggest drops in pressure are on days when there were storms.
I'm not convinced of the accuracy of these readings - I'm pretty sure the relative humidity should get close to 100% outdoors at night. It's possible that the sensor enclosure restricts airflow too much, or it's affected by proximity to the house.